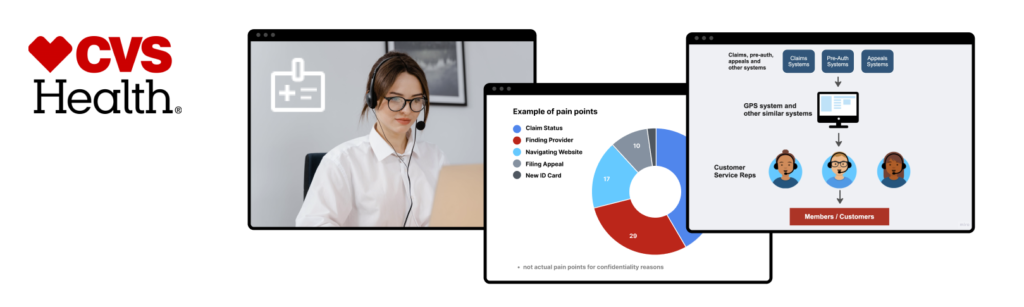
Aetna is one of the largest health insurance companies in the US, serving 22 million members. They are a subsidiary of CVS Health with a network that includes 1.2 million healthcare professionals.
I joined Aetna’s UI/UX team via PWC and led a UX research project. I explored the member and customer service representative (CSR) experiences, collecting crucial data on health insurance users’ pain points and frustrations. The project’s objective was to gather, analyze data, and craft reports to steer forthcoming technical solutions. These solutions target alleviating pain points, boosting efficiency, and enhancing the member experience, as reflected in the NPS (Net Promoter Score).
*For confidentiality reasons I will not share real data that was gathered.
Researching the CSR experience
I began by researching the Customer Service Representative experience. CSRs serve as the crucial link connecting members with the answers to their queries.
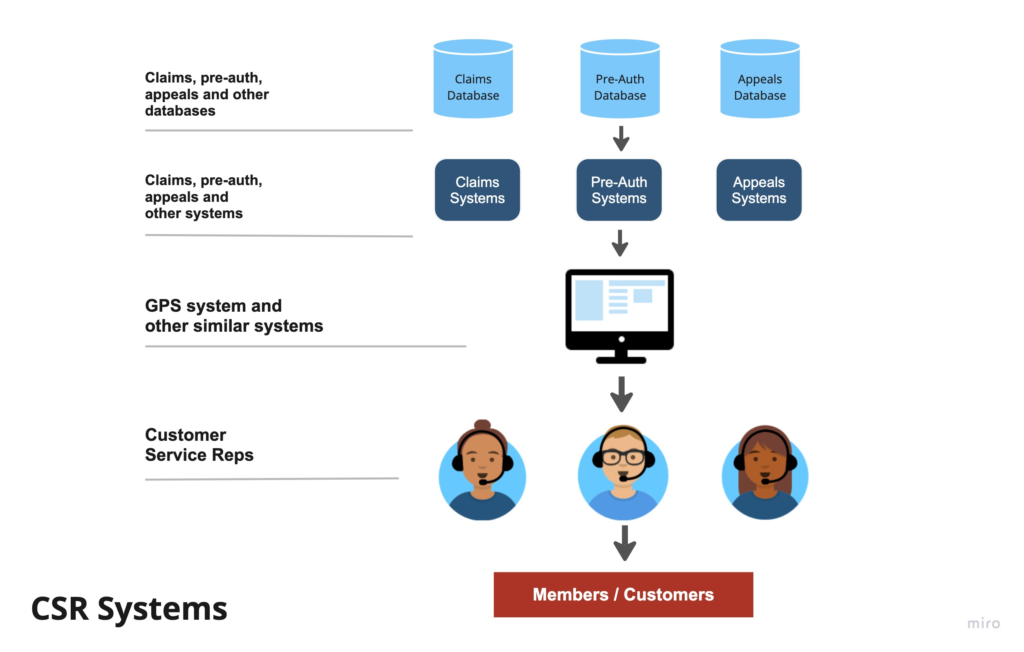
The CSR systems
Information moves from databases and internal departments to systems like GPS and other customer relationship management tools.
Therefore, it was essential to investigate and document the gaps, challenges, and frustrations that happened in the CSR experience while utilizing CRM systems.
This is a simple diagram of how these complex systems interact with each other.
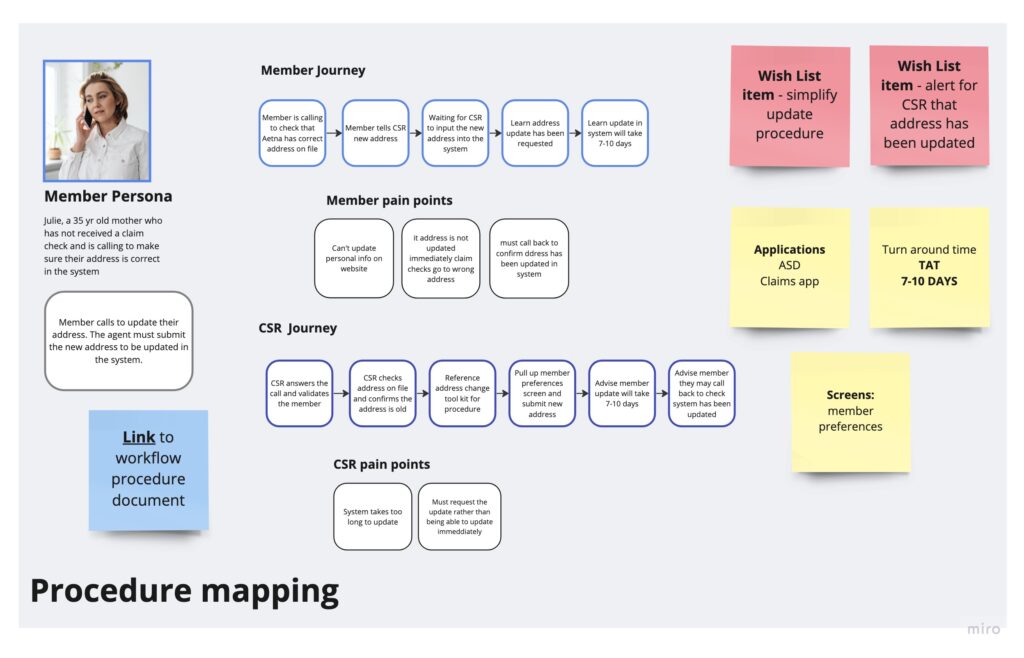
Journey Mapping
I led journey mapping sessions involving CSR stakeholders and Subject Matter Experts (SMEs) to analyze 60 procedures carried out by CSRs when assisting members at the Member Services call center.
This analysis pinpointed critical moments where the CRM system influenced communication, issue resolution, and the member experience. The goal was to use this information to propose solutions and initiatives that would ensure smooth operations and aid CSRs in providing exceptional service.
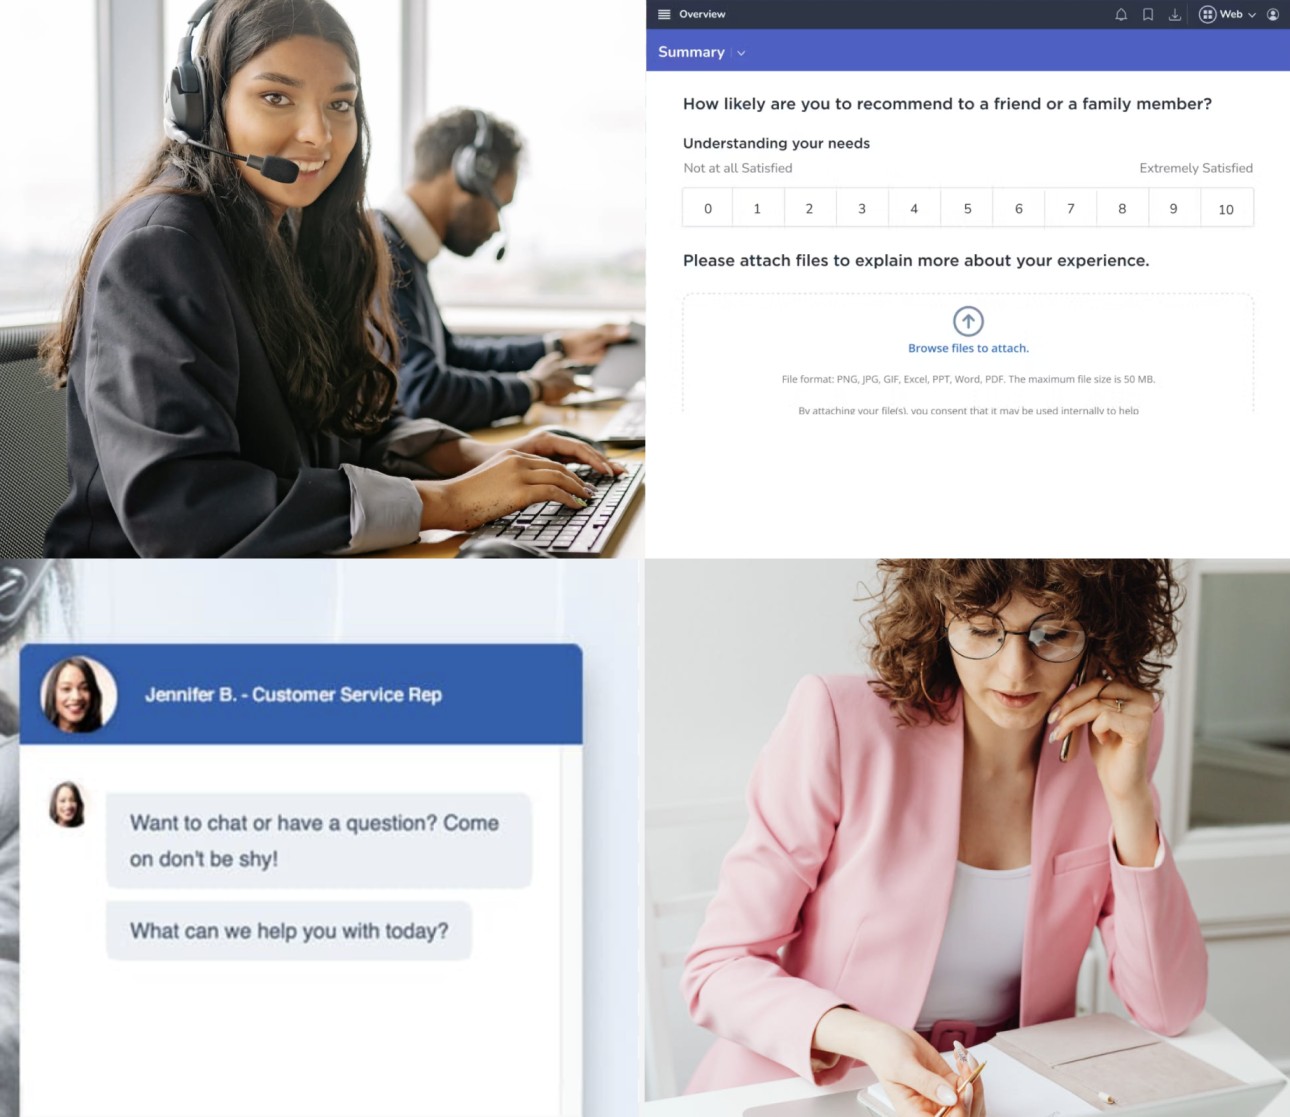
Researching the member experience
To understand the member experience when using their health insurance I looked at customer surveys, listened to customer service calls and reviewed web chat transcripts.
Medallia Customer Surveys
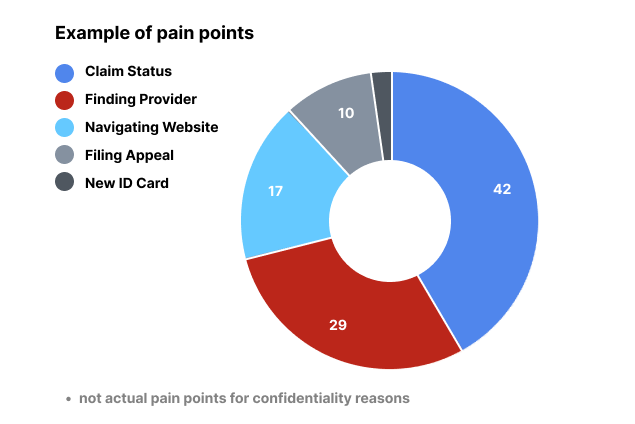
I audited 400 customer surveys in Medallia, documenting the most prevalent pain points members faced while using their health insurance and seeking answers to their questions.
Verint Call Studies
I listened to 600 member calls to the service line in the Verint application, documenting both member experience pain points and frustrations, as well as difficulties faced by the CSRs.
Review Web Chat
I audited 200 web chat transcripts, documenting pain points and incidents where members’ issues were not resolved and recording the most common topics that causes difficulties for members or CSRs.
Compiling the results
I collected and analyzed data from member surveys to identify prevalent pain points by percentage. Additionally, I documented primary pain points derived from the call center analysis and web transcript data, revealing trends and common problems.
This in-depth UX study unveiled a comprehensive list of pressing member pain points across various touch points—from call center to website and web chat services. I also complied detailed insights into the top pain points experienced by customer service representatives while using the CRM system to assist members with diverse inquiries regarding care access, claims, and benefits.
Exploring the member digital experience in depth
After identifying the main issues, I partnered with a digital team to map the website and analyze common member tasks using real user experiences. Our strategy involved delving deeper by utilizing Quantum metrics from the site and pairing it with call center data to comprehensively understand the member experience while they navigate task completion.
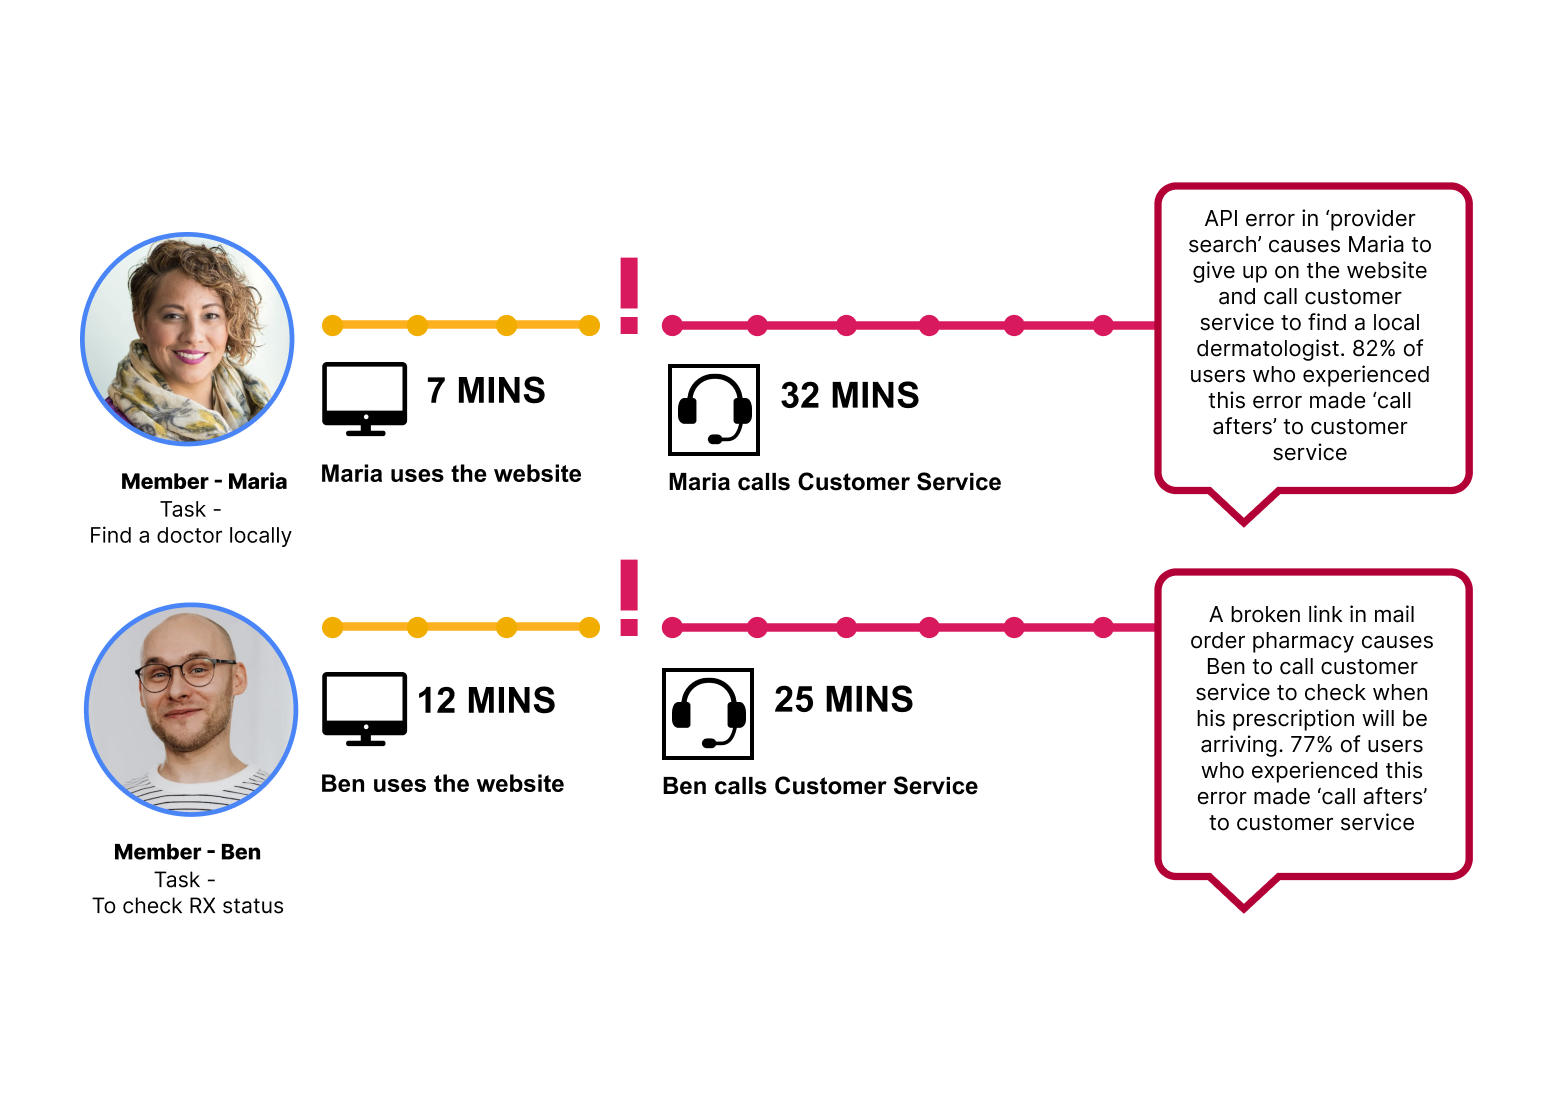
Below is an example of how this process works, using 3 member personas who are trying to complete common health insurance related tasks.
Member - Tonya
Member ID #
Task – To check a claim
Member - Ben
Member ID #
Task – To check RX status
Member - Maria
Member ID #
Task – To find a doctor locally
User Journey and pain points
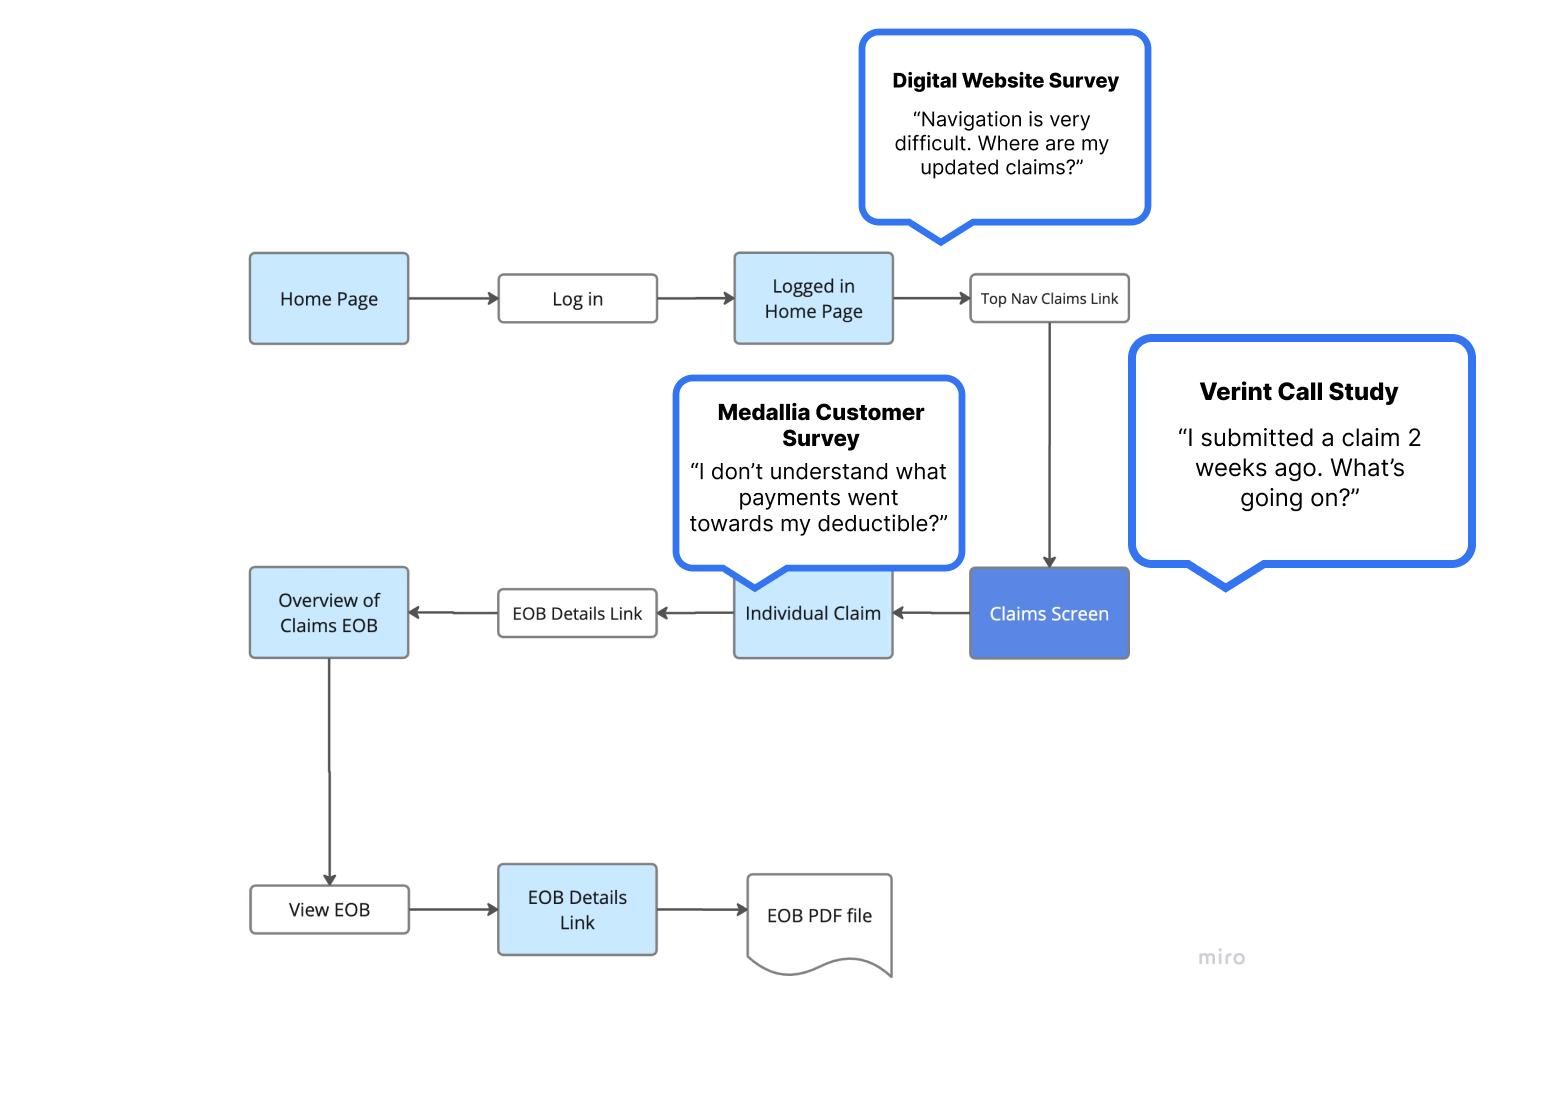
By documenting the user’s current path and referencing member survey comments about the online claims experience we can begin to understand what Tonya may be experiencing as she tries to check on her claim.
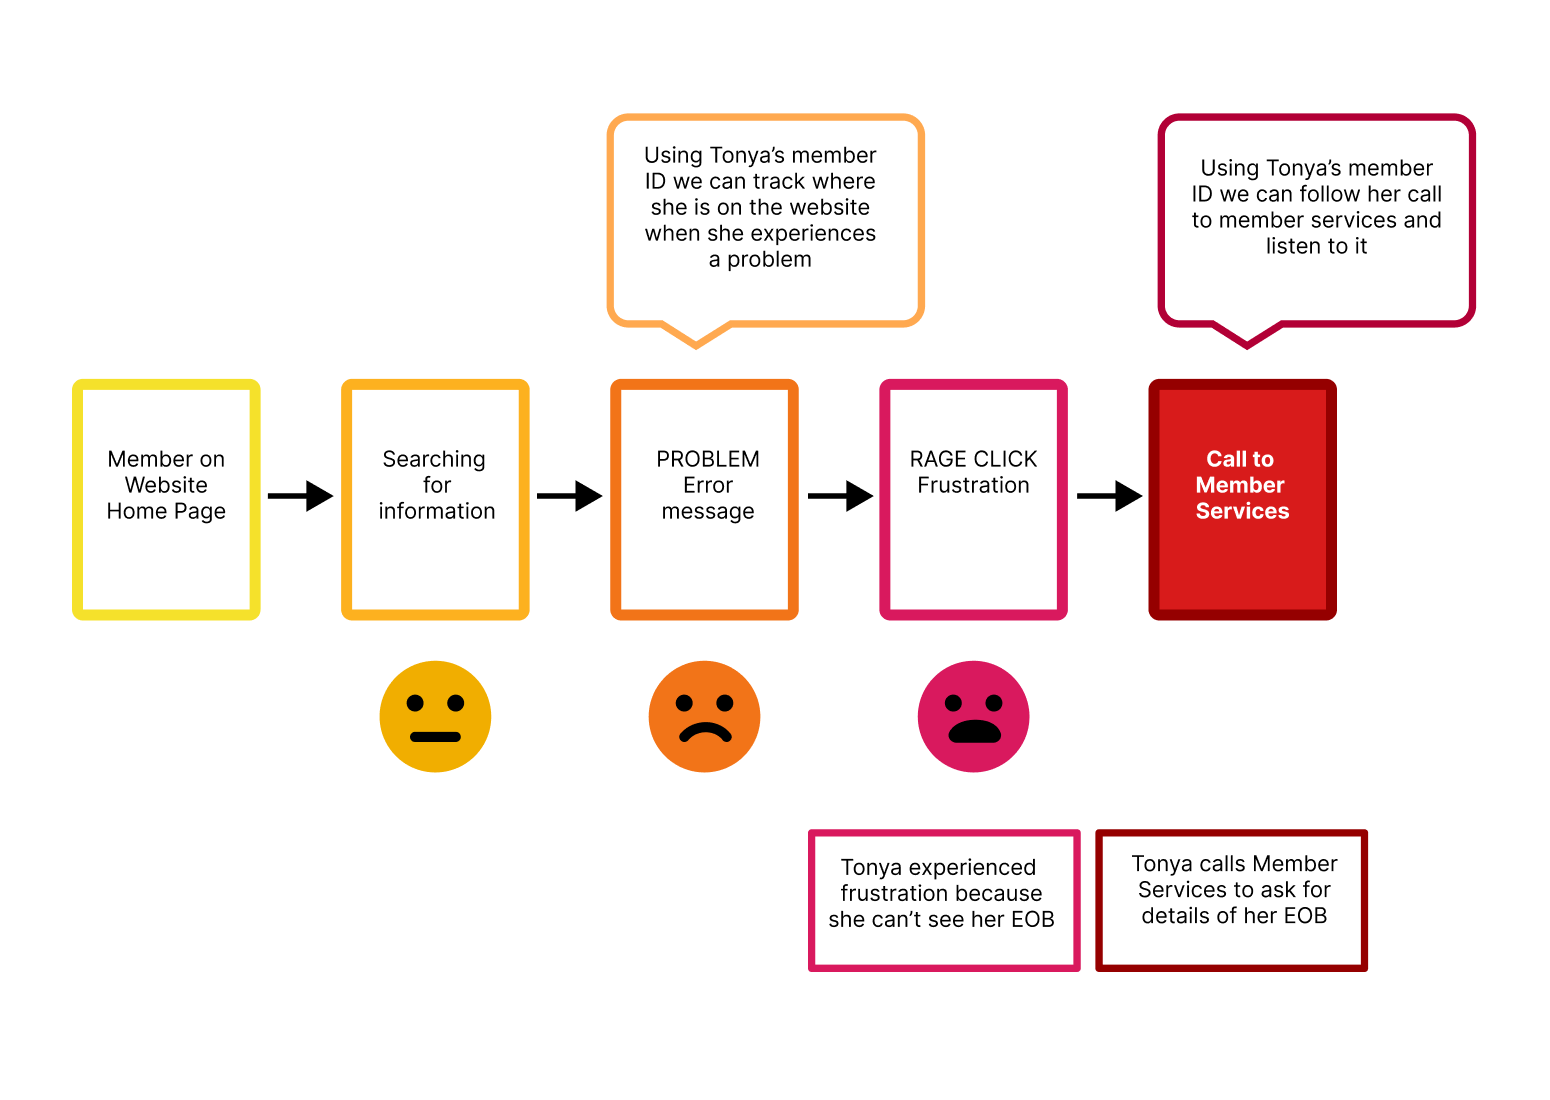
Frustration point
Tonya wants to view her EOB / Explanation of Benefits, but she receives an error message stating it is not available to view online and the EOB can only be provided via pdf
Facilitate Self Service
Identifying the place where digital self service breaks down for Tonya and initiating a solution is beneficial for both Tonya and the company
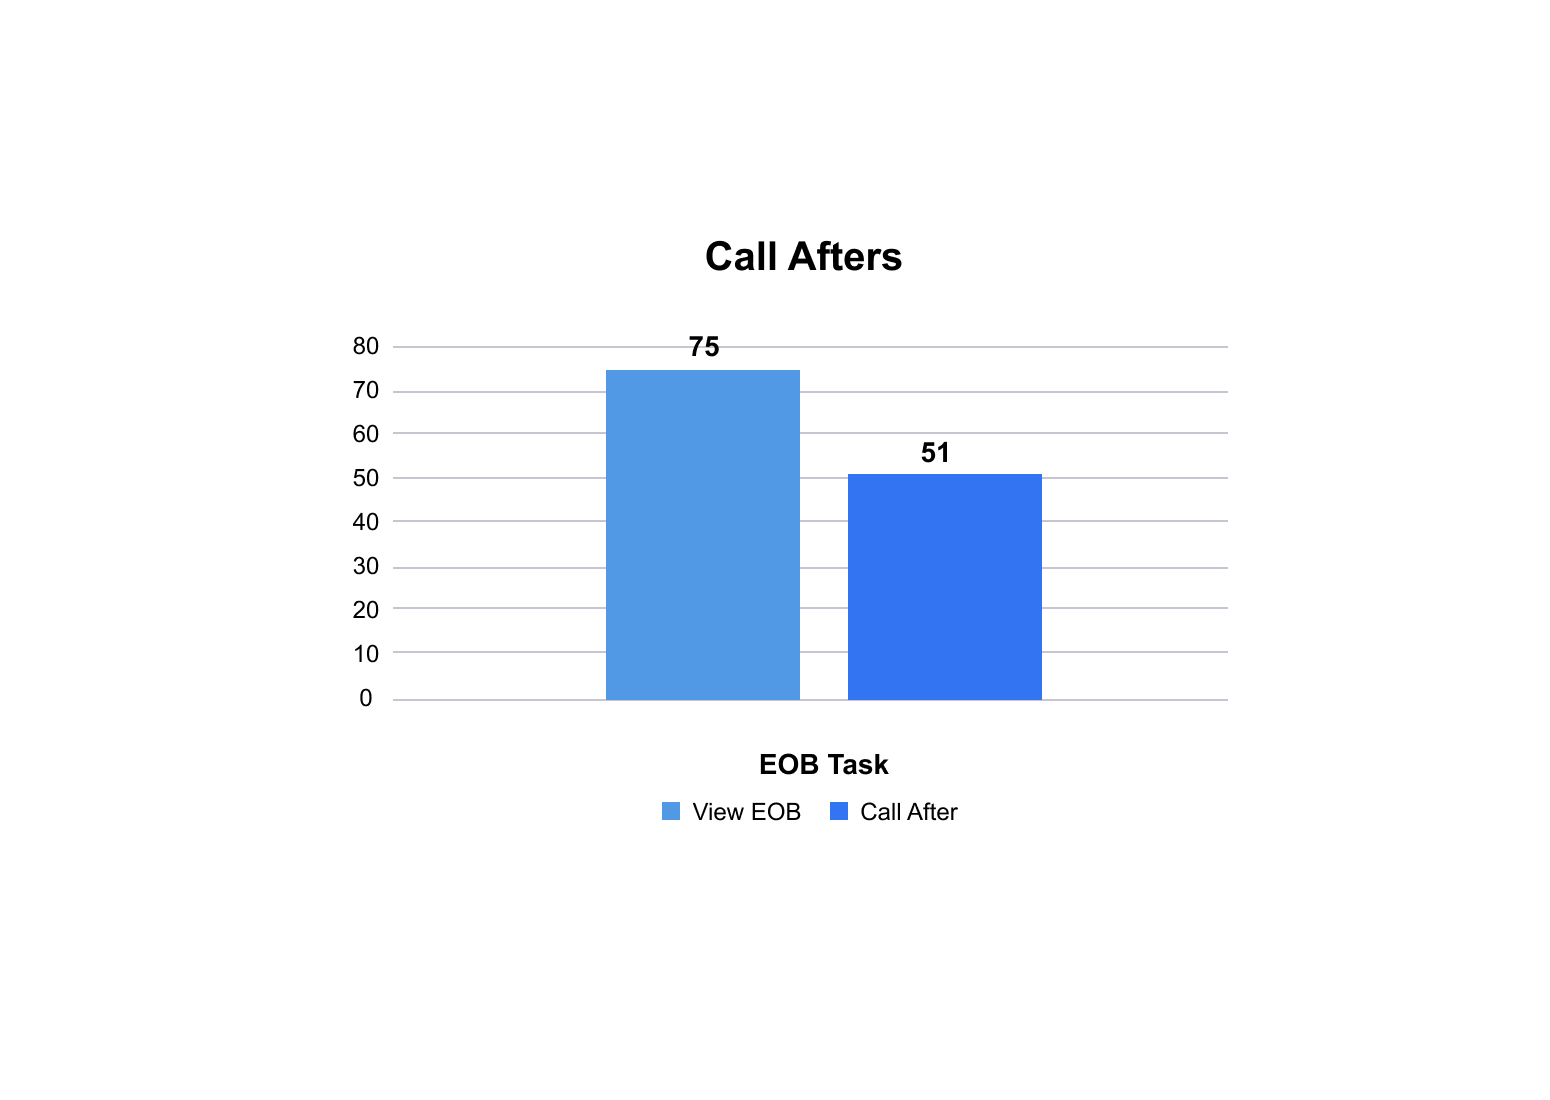
EOB Task
Quantum metrics Using Tonya’s experience as an example we can also analyze how many other members have had this issue and what the impact is on the call center. Reference Sample – 1 week 75 members clicked ‘View EOB’ 51 members called after clicking ‘View EOB’ Impact 2652 calls per year There is a 68% chance a member will call due to this error
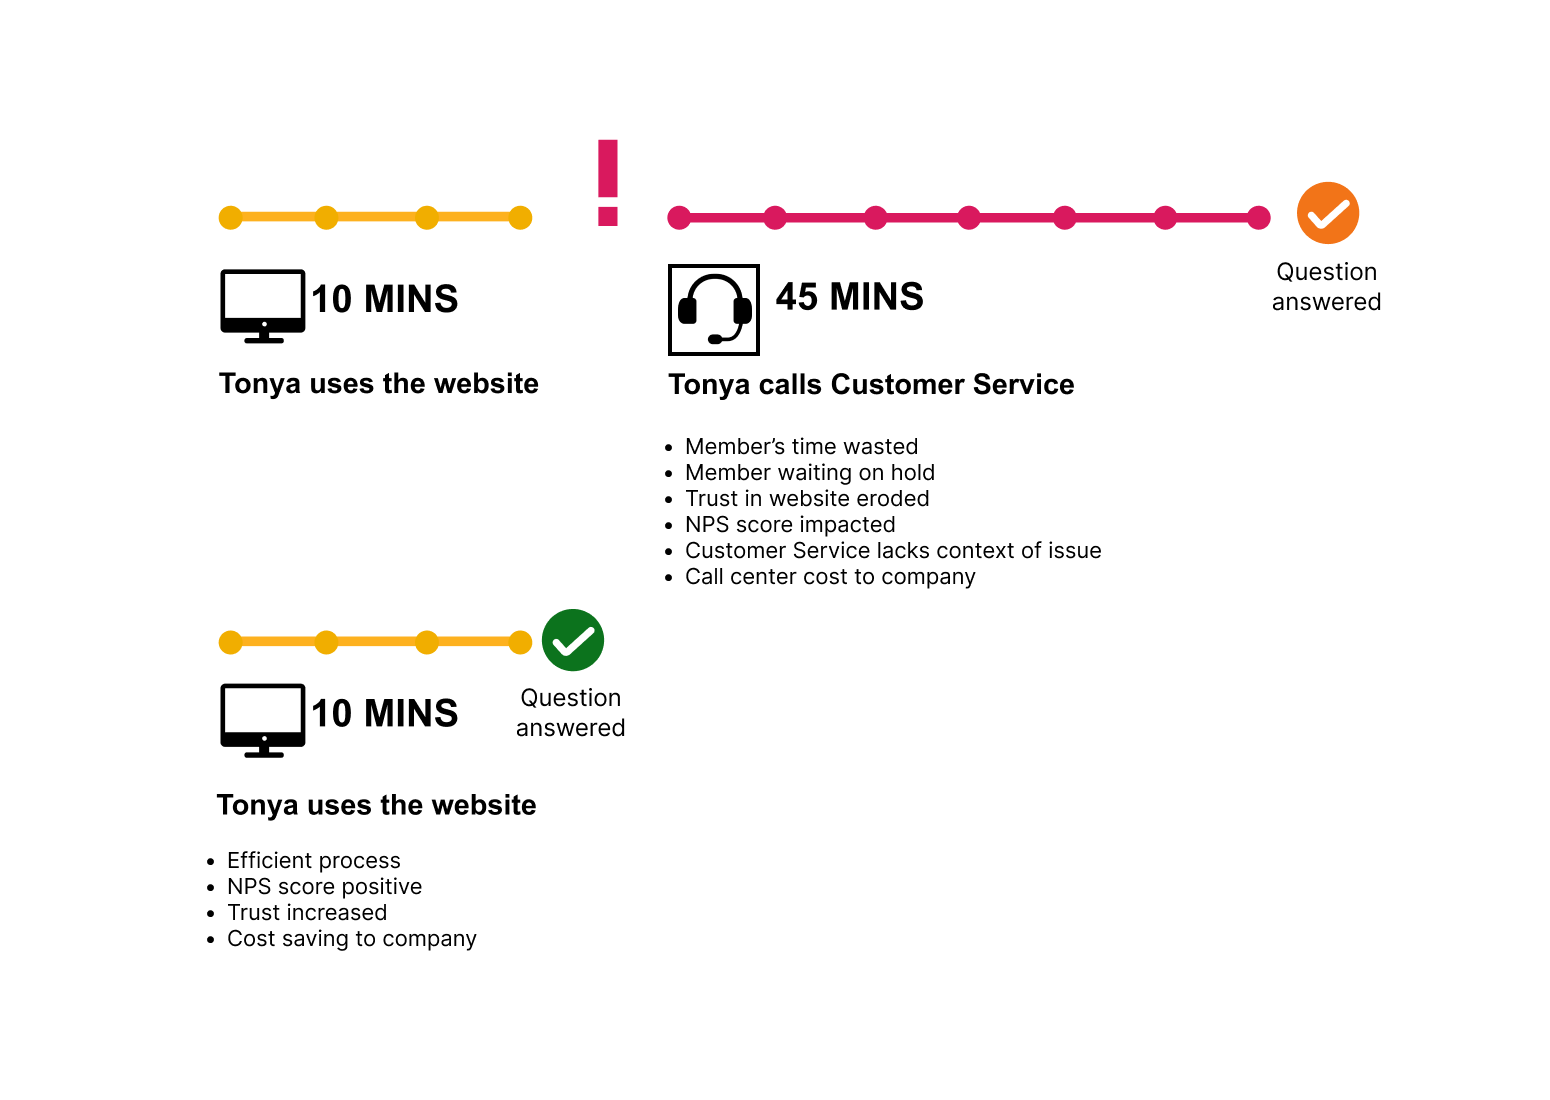
Impact of Digital Friction
How does digital friction impact members and the organization?
We can follow other user experiences to highlight pain points and errors in the members journeys, show the size and impact of reported issues and calculate the UX impact.
Summary
The information we gather from this process will facilitate the elimination of pain points and frictions and the creation of a seamless member experience on the website where members will be able to self serve and therefore avoid calls to the call center.